Software Architecture
The software architecture of the digital robot arm twin can be used for digital testing of movement range and speed. Also, collisions can be checked in advance. Currently, only the SCARA kinematic robot arm is modeled and visualized. Later on, the entire plastic sorting and handling system could be modeled the same way.
Simulation
For maximum software portability, the simulation is developed in python. This way it can be easily run on a Linux compute module in the real robot arm as well as on a high performing simulation computer. By incorporating this aspect multiple robots can be run in parallel on different virtual machines. Training machine learning models for path planning or gripping positions can be achieved this way. The overall robot software consists of a waypoint manager, the robot arm equivalent, the mathematical models including e.g. inverse kinematics and a dynamic model. Additionally, the position and speed controllers are implemented as PID control algorithms. Inverse kinematics models help to determine the individual joint angles and extensions based on a given end-effector position and rotation. The dynamic model provides a description of the relationship between the joint actuator torques and the motion of the structure.1 For visualization access, the robot arm position values are written to a CSV file.
Visualization
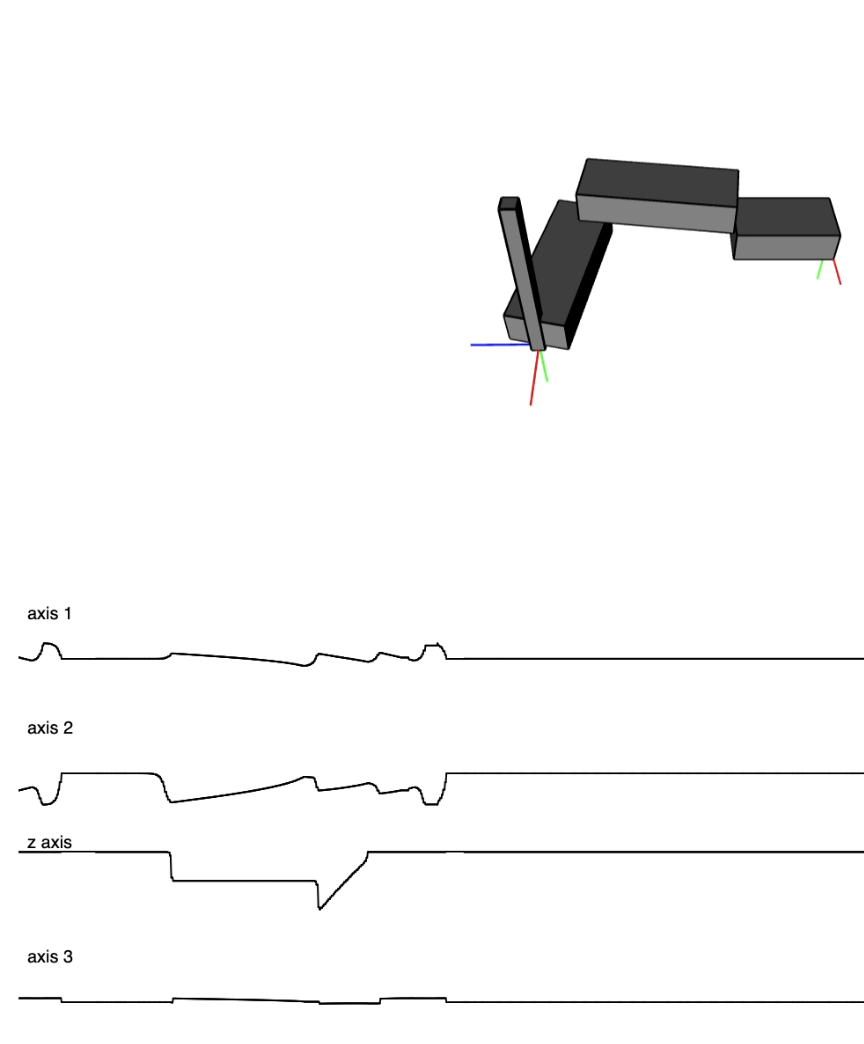
The visualization is implemented in javascript and can be run using your preferred browser. It uses p5.js which is a JavaScript library for creative coding, with a focus on making coding accessible and inclusive for artists, designers, educators, beginners, and anyone else. 2 Joint angles of the robot arm are acquired from the CSV file every update cycle. Then the values are plotted to the 3D visualization frame as well as the data graphs.
Conclusion
The simulation and visualization were tested using a 2,7 GHz Quad-Core Intel Core i7 without a graphics card. With this setup, a visualization frame rate of 20 fps was achieved. The simulation runs at 1 ms period time of the software loop. So far no performance tests have been executed on a real-time hardware platform. The result can be seen in Figure 1.